Inside Sightseer Coffee's Roasting Operation

photo by Jana Birchum, posted Oct. 9, 2023. #5 of 21 photos.
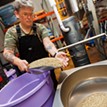
Zash monitors the roasting process. Each chart onscreen is made from data pulled from the thermal couples in the roasting machine. That information helps her make decisions about how best to bring out characteristics of the beans. For example, the batch Zash was roasting in this picture was soft, buttery, and with a little bit of caramel to it, so she extended the length of time the beans spent in the hopper before “first crack” (aka when the coffee beans get that signature split down the middle) in order to accentuate those caramel notes.